Earth's Climate History
Today I would like to present very interesting article about climatic history of planet Earth I have found on-line. Nice reading - you can write some conclusions in the comment section.
Reconstructing Past Climates
A wide range of evidence exists to allow climatologists to reconstruct the Earth's past climate. This evidence can be grouped into three general categories.
The first category is meteorological instrument records. Common climatic elements measured by instruments include temperature, precipitation, wind speed, wind direction, and atmospheric pressure. However, many of these records are temporally quite short as many of the instruments used were only created and put into operation during the last few centuries or decades. Another problem with instrumental records is that large areas of the Earth are not monitored. Most of the instrumental records are for locations in populated areas of Europe and North America. Very few records exist for locations in less developed countries (LDCs), in areas with low human populations, and the Earth's oceans. Over the last half century many meteorological stations have been added in land areas previously not covered. Another important advancement in developing a global record of climate has been the recent use of remote satellites.
Written documentation and descriptive accounts of the weather make up the second general category of evidence for determining climate change. Weather phenomena commonly described in this type of data includes the prevailing character of the seasons of individual years, reports of floods, droughts, great frosts, periods of bitter cold, and heavy snowfalls. Large problems exist in the interpretation of this data because of its subjective nature.
Many types of physical and biological data can provide fossil evidence of the effects of fluctuations in the past weather of our planet. Scientists refer to this information as "proxy data" of past weather and climate. Examples of this type of data include tree ring width and density measurements, fossilized plant remains, insect and pollen frequencies in sediments, moraines and other glacial deposits, marine organism fossils, and the isotope ratios of various elements. Scientists using this type of data assume uniformity in the data record. Thus, the response measured from a physical or biological character existing today is equivalent to the response of the same character in the past. However, past responses of these characters may also be influenced by some other factor not accounted for. Some common examples of proxy data include:
Glacial Ice Deposits. Fluctuations in climate can be determined by the analysis of gas bubbles trapped in the ice which reflect the state of the atmosphere at the time they were deposited, the chemistry of the ice (concentration or ratio of major ions and isotopes of oxygen and hydrogen), and the physical properties of the ice.
Biological Marine Sediments. Climate change can be evaluated by the analysis of temporal changes in fossilized marine fauna and flora abundance, morpological changes in preserved organisms, coral deposits, and the oxygen isotopic concentration of marine organisms.
Inorganic Marine Sediments. This type of proxy data includes clay mineralogy, aeolian terrestial dust, and ice rafted debris.
Terrestrial Geomorphology and Geology Proxy Data. There are a number of different types of proxy data types in this group including glacial deposits, glacial erosional features, shoreline features, aeolian deposits, lake sediments, relict soil deposits, and speleothems (depositional features like stalactites and stalagmites).
Terrestial Biology Proxy Data. Variations in climate can be determined by the analysis of biological data like annual tree rings, fossilized pollen and other plant macrofossils, the abundance and distribution of insects and other organisms, and the biota in lake sediments.
Earth's Climatic History
Climatologists have used various techniques and evidence to reconstruct a history of the Earth's past climate. From this data they have found that during most of the Earth's history global temperatures were probably 8 to 15° Celsius warmer than today. In the last billion years of climatic history, warmer conditions were broken by glacial periods starting at 925, 800, 680, 450, 330, and 2 million years before present.
The period from 2,000,000 - 14,000 B.P. (before present) is known as the Pleistocene or Ice Age. During this period, large glacial ice sheets covered much of North America, Europe, and Asia for extended periods of time. The extent of the glacier ice during the Pleistocene was not static. The Pleistocene had periods when the glacier retreated (interglacial) because of warmer temperatures and advanced because of colder temperatures (glacial). During the coldest periods of the Ice Age, average global temperatures were probably 4 - 5° Celsius colder than they are today.
The most recent glacial retreat is still going on. We call the temporal period of this retreat the Holocene epoch. This warming of the Earth and subsequent glacial retreat began about 14,000 years ago (12,000 BC). The warming was shortly interrupted by a sudden cooling, known as the Younger-Dryas, at about 10,000 - 8500 BC. Scientists speculate that this cooling may have been caused by the release of fresh water trapped behind ice on North America into the North Atlantic Ocean. The release altered vertical currents in the ocean which exchange heat energy with the atmosphere. The warming resumed by 8500 BC. By 5000 to 3000 BC average global temperatures reached their maximum level during the Holocene and were 1 to 2° Celsius warmer than they are today. Climatologists call this period the Climatic Optimum. During the climatic optimum many of the Earth's great ancient civilizations began and flourished. In Africa, the Nile River had three times its present volume, indicating a much larger tropical region.
From 3000 to 2000 BC a cooling trend occurred. This cooling caused large drops in sea-level and the emergence of many islands (Bahamas) and coastal areas that are still above sea-level today. A short warming trend took place from 2000 to 1500 BC, followed once again by colder conditions. Colder temperatures from 1500 - 750 BC caused renewed ice growth in continental glaciers and alpine glaciers, and a sea-level drop of between 2 to 3 meters below present day levels.
The period from 750 BC - 900 AD saw warming up to 150 BC. Temperatures, however, did not get as warm as the Climatic Optimum. During the time of Roman Empire (150 BC - 300 AD) a cooling began that lasted until about 900 AD. At its height, the cooling caused the Nile River (829 AD) and the Black Sea (800-801 AD) to freeze.
The period 900 - 1200 AD has been called the Little Climatic Optimum. It represents the warmest climate since the Climatic Optimum. During this period, the Vikings established settlements on Greenland and Iceland. The snow line in the Rocky Mountains was about 370 meters above current levels. A period of cool and more extreme weather followed the Little Climatic Optimum. A great drought in the American southwest occurred between 1276 and 1299. There are records of floods, great droughts and extreme seasonal climate fluctuations up to the 1400s.
From 1550 to 1850 AD global temperatures were at their coldest since the beginning of the Holocene. Scientists call this period the Little Ice Age. During the Little Ice Age, the average annual temperature of the Northern Hemisphere was about 1.0 degree Celsius lower than today. During the period 1580 to 1600, the western United States experienced one of its longest and most severe droughts in the last 500 years. Cold weather in Iceland from 1753 and 1759 caused 25 % of the population to die from crop failure and famine. Newspapers in New England were calling 1816 the year without a summer.
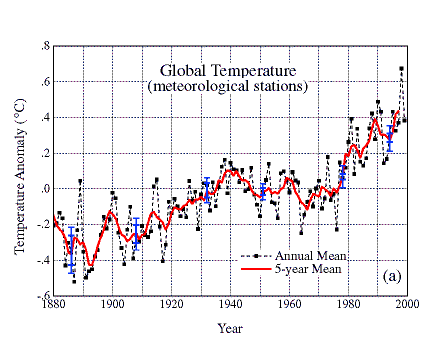
The period 1850 to present is one of general warming. Figure 7x-1 describes the global temperature trends from 1880 to 1999. This graph shows the yearly temperature anomalies that have occurred from an average global temperature calculated for the period 1951-1980. The graph indicates that the anomolies for the first 60 years of the record were consistently negative. However, beginning in 1935 positive anomolies became more common, and from 1980 to 1999 the anomolies were between 0.2 to 0.4° Celsius higher that the average for the 119 year period of study.

| Figure 7x-1: Near-global annual-mean temperature change for the period 1880 to 1999 (deviation from the normal period 1951-1980). (Source: NASA Goddard Institute for Space Studies - Global Temperature Trends) |
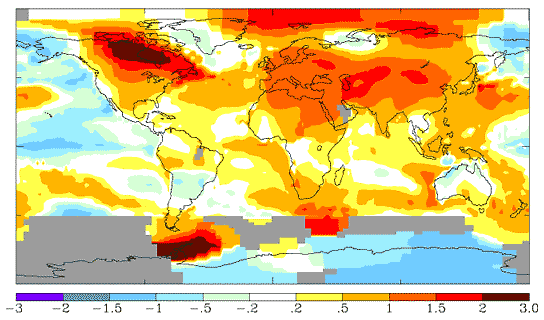
In the 1930s and 1950s, the central United States experience two periods of extreme drought. The 1980s and 1990s had ten of the warmest years this century and possibly since the Little Climatic Optimum. Proxy and instrumental data indicate that 1998 was the warmest year globally in 1200 years of Earth history. In the following year, a La Nina developed and global temperatures dropped slightly. Nevertheless, the mean global temperatures recorded for this year was the sixth highest measurement since 1880. Many scientists believe the warmer temperatures of the 20th century are being caused by an enhancement of the Earth's greenhouse effect.

| Figure 7x-2: In 1999, most parts of the world were warmer than normal. The illustration above describes the annual temperature deviation (from the base period 1950-1980) in degrees Celsius for the Earth's surface. The illustration indicates that it was particularly warm across most of North America, northern Africa, and most of Eurasia. The tropical Pacific Ocean was cool due to a strong La Nina. (Source: NASA Goddard Institute for Space Studies - Global Temperature Trends). |

1 Comments:
Very interestin! So do you think that human beings and our modern way of life is significantly contributing to global warming, or is current climate change just a cyclic, periodic event?
Post a Comment
<< Home